Kaspa Price Analysis: A Closer Look at Recent Trends
Including Kaspa in CoinMarketCap’s “Made in America” assets page might have contributed to this sudden price increase. This platform’s influence in the crypto space is significant, and American assets have generally seen positive performance in recent months, with cryptocurrencies like HBAR, ADA, and XRP also showing strength.
Looks like @CoinMarketCap added $KAS to its “Made in America” assets page. $KAS is also leading the market today, interestingly… pic.twitter.com/X6ysR90ajb
— Jim, S𐤊i ₿um ⛷ (@skibumtrading) March 11, 2025
Kaspa Chart Shows Trouble Ahead
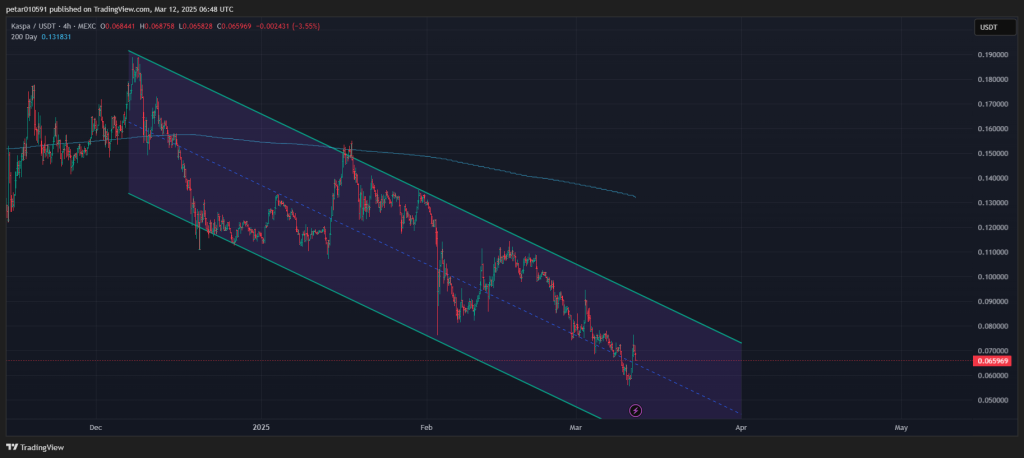
The 4-hour chart for Kaspa indicates a troubling downward trend, characterized by lower highs and lower lows, which is a classic sign of a bearish market. Currently, Kaspa is hovering near the lower boundary of this channel, which might act as temporary support.
The 200-day moving average, sitting at about $0.13, is significantly above the current price, reinforcing the control of the downtrend. Until Kaspa can break above this key indicator, the market sentiment remains bearish.

Key levels to watch include:
- Support: The current price around $0.0659 is the first line of defense. A break below could see prices drop to the $0.0600-$0.0550 range.
- Resistance: Kaspa faces resistance at $0.0700-$0.0720, with a stronger barrier at $0.0800-$0.0850 where previous rallies have stalled.
Technical indicators like the RSI at 50 and the Ultimate Oscillator at 43 suggest a market that’s neither oversold nor overbought, indicating a balanced but cautious outlook.
Kaspa Short-Term Price Predictions
Here are a few potential scenarios for Kaspa’s price movement:
- If Kaspa breaks”Source: captainaltcoin.com
