Kaspa’s Momentum Builds: Will June See Another Price Surge?
Kaspa (KAS) has emerged as one of the most reliable cryptocurrencies in terms of performance in 2025. After experiencing a series of pullbacks, the indicators now suggest that a significant upward movement might be on the horizon for Kaspa as we approach June. The current price stability above the critical $0.10 support level has sparked optimism among traders and investors. Is this the quiet before another bullish run for Kaspa?
Kaspa Recovers, Surpassing Key Moving Averages
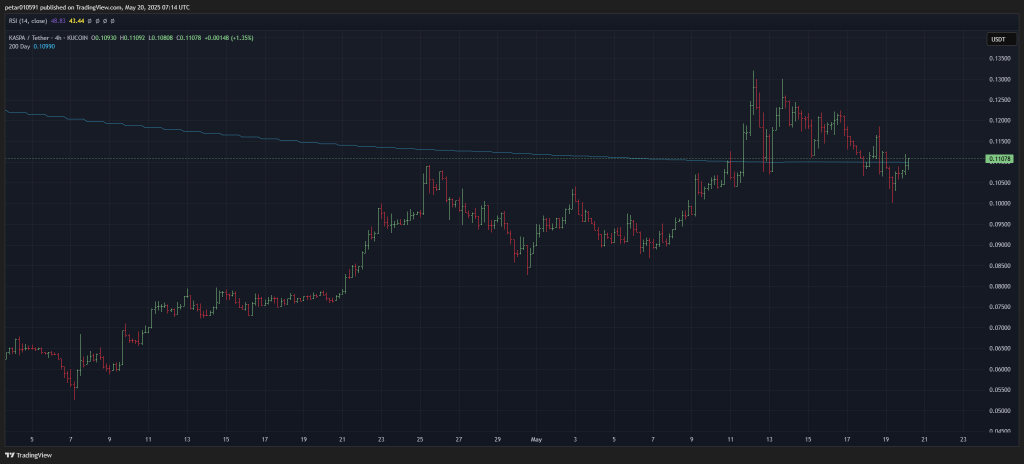
Currently, Kaspa is trading at approximately $0.1107, marking a 1.35% increase from the last session. A notable technical event has seen KAS reclaiming the 200-day moving average on the 4-hour chart, now sitting at $0.1099. This reclaimed moving average serves not only as a potential support level but also as a sign of returning bullish momentum.

The cryptocurrency managed a swift recovery following a dip to around $0.103 on May 18th, showing resilience by forming higher lows and holding above essential trendlines.
Weekly Chart Indicators Favoring Upward Movement
The weekly technical indicators are displaying clear signals of growing bullish momentum:
| Indicator | Value | Interpretation |
|---|---|---|
| MACD | -0.009 | Negative but flattening out – potential trend shift |
| CCI | 115.40 | Exhibits strong momentum, slightly overbought |
| ATR | 0.0204 | Indicates higher volatility |
| Ultimate Oscillator | 61.15 | Signaling increasing buying strength |
| ROC | 2.917 | Positive momentum indicative of an early rally |
Both the CCI over 100 and Ultimate Oscillator above 60 underscore a build-up in buying pressure. The MACD, although still negative, is showing signs of a potential bullish crossover, which could add further confirmation to an upcoming price increase.
Key Levels to Watch
The $0.115 zone has been a tough resistance for Kaspa in recent times. A decisive move above this level on substantial volume could propel the price towards $0.13 to $0.145. If breached, historical peaks could be retested if investor sentiment remains positive. However, a dip under the 200-day moving average or a break below $0.103 might set the stage for a correction towards $0.096 or even $0.092, potentially putting any immediate bullish trends on pause.
Kaspa Price Prediction for June
Here’s what could transpire in June:
- Bullish Case: A clear breakout from $0.115 could see Kaspa climbing to between $0.13 and $0.145, with aspirations to reach $0.16 by the end of the month.
- Neutral Case: If Kaspa trades within the $0.105 to $0.115 range, it would indicate a lack of directional momentum, perhaps waiting on market cues or external news.
- Bearish Case: A drop below the critical $0.103 support level might signal a bearish turn, targeting lower levels at $0.096 or $0.092, with any rally deferred into the future.
The technical indicators are leaning towards a bullish outcome for Kaspa in June. The focus should be on the $0.115 resistance level. If Kaspa can overcome this with strong market backing, June might witness another significant price surge.
Interested in Cryptocurrency Trading?
Consider eToro for your trading needs. Enjoy features like social trading, a wide array of assets, and a beginner-friendly platform, all while being cautioned with the high-risk nature of cryptocurrency investments.
Stay updated with the latest crypto trends by following us on X (Twitter), CoinMarketCap , and checking our recent news and technical analysis.
The post Is Kaspa Price Ready for a June Rally? These Signals Say Yes appeared first on CaptainAltcoin.
Source: captainaltcoin.com
