“`html
The Kaspa price surged by 11% today, now trading above $0.16. This marks the highest KAS price since September.
An analyst from 2xnmore shared a viral Kaspa chart today, which has caught the attention of many traders.
Kaspa Chart Indicates Strong Upward Momentum
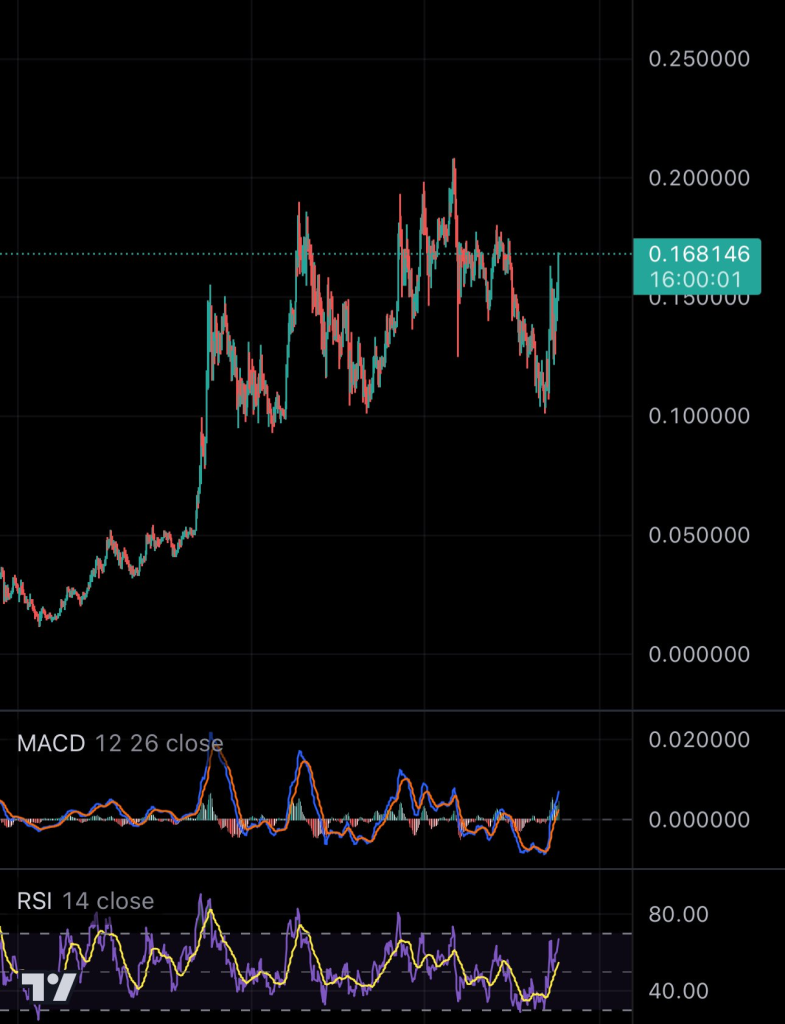
Currently, KAS is trading at $0.168146. The price of Kaspa has been quite volatile recently, with significant fluctuations. Notably, it has broken out of the $0.10-$0.12 range where it had been trading for a while.
The overall trend appears promising – higher lows and higher highs are being observed, which is generally considered a bullish signal. Despite some dips, the price has consistently rebounded. There is strong support around the $0.10-$0.12 range, with the price bouncing off these levels multiple times.

The MACD, a widely used technical indicator, is showing bullish signals as it moves above the signal line. The RSI is also trending upwards, though it is approaching overbought levels, which could indicate a period of consolidation is near.
2xnmore highlighted that KAS often “operates in its own league and pumps when it feels like,” implying that it doesn’t necessarily follow broader market trends. While there is some resistance around the $0.20-$0.25 range, where the price was previously rejected, KAS seems to be making another attempt to reach these levels.
Read also: How Much Will 65,000 KAS Tokens Be Worth by 2025? Kaspa Price Prediction
The chart suggests that further upside is possible, but the key will be whether KAS can break through the $0.20 mark. If it fails to do so, we could see a pullback to test support at $0.15 or even lower. As always with cryptocurrency, price movements can be”
Source: captainaltcoin.com
