“`html
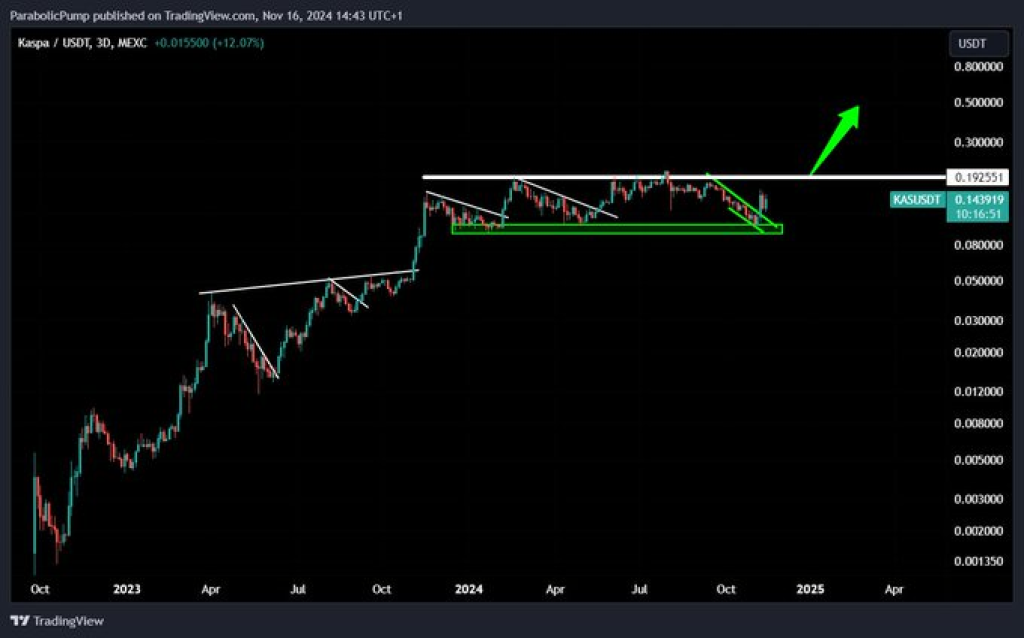
Top analyst ParabolicPump recently shared on X (formerly Twitter) that Kaspa (KAS) has been in a consolidation phase for nearly a year. However, many analysts and traders are now pointing to the possibility of a breakout from this prolonged period of range-bound trading. This extended phase of consolidation has set the stage for a potential upward move as the token approaches key resistance levels.
The analyst also underscores the cyclical nature of cryptocurrency markets and the importance of making strategic decisions during periods of volatility. ParabolicPump mentioned that once KAS breaks out of its current range, a parabolic rally could ensue, potentially pushing the token into price discovery territory.
KAS Chart Analysis: Consolidation Phase and Key Support Levels
Kaspa’s price has been trading within a horizontal range between $0.08 and $0.19 for the past year. This accumulation phase has established a strong support zone near $0.08, where significant buying interest has been observed. The chart shared by ParabolicPump identifies this green horizontal zone as the base where “smart money” has been accumulating.
Recent price action shows a bounce off this support zone, indicating renewed bullish momentum. The breakout from a descending green channel within this range further supports the idea of higher lows and higher highs forming in the coming weeks.

Resistance Levels and Breakout Potential
The $0.19 resistance level remains a significant barrier for KAS. Analysts have noted that repeated tests of this resistance weaken its strength, increasing the likelihood of a breakout. The chart suggests that once this resistance is surpassed, KAS’s price could aim for levels near $0.50, a psychological and technical milestone for traders.
ParabolicPump’s analysis also highlights that while volatility has been relatively low, this is expected to change soon. The combination of technical patterns, including the symmetrical triangle, points to a potential bullish breakout in the near future.
