“`html
Kaspa (KAS) is currently undergoing a period of price consolidation, with technical indicators and market data shedding light on its recent performance.
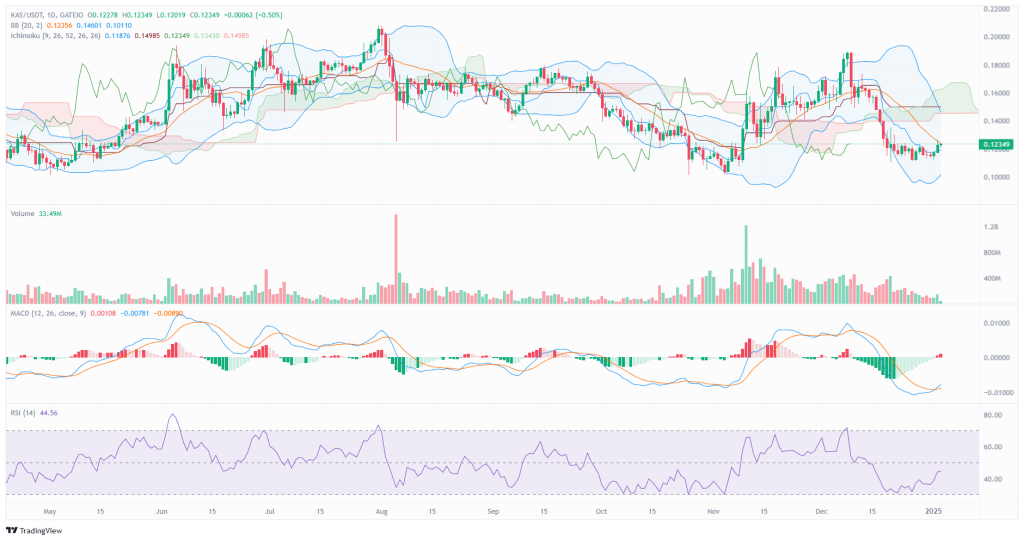
An analysis of Kaspa’s daily chart on TradingView, along with data from CoinGlass, reveals significant trends such as reduced volatility and bearish momentum. These insights also suggest shifting market participation, potentially paving the way for future market movements.
Kaspa Price Analysis
The daily price chart for KAS, as observed on TradingView, indicates that the cryptocurrency has been trading within a narrow range of $0.10 to $0.20 over the past few months.
At its current price of $0.12349, KAS has shown a slight upward movement of 0.50% for the day. While the price trend has been predominantly downward since mid-September, recent activity suggests consolidation around the $0.12 mark, which could potentially serve as a base for future movements.

The Bollinger Bands on the chart are contracting, which is indicative of reduced market volatility. The upper and lower bands are positioned at $0.14601 and $0.10110, respectively.
Additionally, the middle band (SMA-20) is closely aligned with the current price, further supporting the notion of a consolidation phase. This setup hints at the possibility of a breakout as market volatility returns.
Ichimoku Cloud Indicates Bearish Sentiment
The Ichimoku Cloud analysis reflects a bearish sentiment, with the price trading below a red cloud. The Tenkan-Sen and Kijun-Sen lines also point to short-term bearish momentum, while the future cloud remains red, suggesting resistance in the $0.14 to $0.15 range. For a trend reversal to occur, the price would need to break above this resistance level.
A potential bullish crossover may be on the horizon, as the MACD line approaches the signal line. However, the indicator remains below zero, indicating that the bearish trend has not yet reversed. The green histogram confirms a reduction in bearish momentum”
Source: captainaltcoin.com
