“`html
After spending nearly a year in consolidation, Kaspa (KAS) has captured the attention of crypto trading analysts who see promise in its current market behavior.
Currently trading at $0.1591, the token’s technical structure has been closely examined by analysts OCT Trades and ParabolicPump. Both have identified specific chart patterns that could indicate potential price movements.
Technical Patterns Signal Potential for KAS
The price charts for KAS reveal compelling patterns for traders to consider.
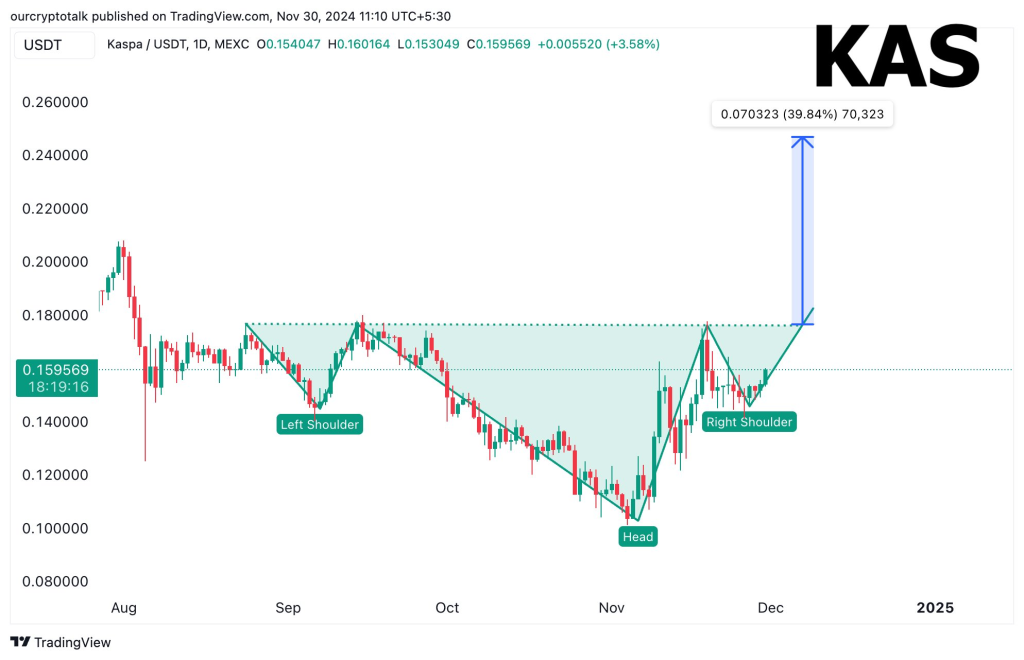
One notable formation is an inverse head and shoulders pattern, which OCT Trades has identified with a neckline at $0.175. This classic technical setup is often associated with bullish price action, leading OCT Trades to project a potential price target of $0.25.

The analyst highlights KAS’s ability to maintain its position above $0.15, establishing this level as a strong support zone. The token’s price action has also shown a series of higher lows, a pattern typically interpreted as growing confidence among buyers in traditional market analysis.
Market Activity Gains Momentum
In the world of cryptocurrency, trading volume often provides key insights, and KAS has been no exception. With $175,867,619 in 24-hour trading volume, the market demonstrates active participation from both buyers and sellers.
The token’s recent 4.95% price increase over the past day, coupled with a steady 0.92% weekly gain, reflects ongoing buying interest. ParabolicPump’s analysis highlights an intriguing aspect of KAS’s market structure: the lack of historical resistance levels above its previous all-time highs.
This absence of resistance could pave the way for price discovery if the token successfully breaks above its established ranges.
Read also: Why 2025 Could Be SUI Network’s Breakout Year
