Kaspa Community Raises Critical Warnings for Kaspa Investors – What’s Happening?
Kaspa Community Raises Critical Warnings for Kaspa Investors – What’s Happening?
Kaspa Community Concerns on Exchange Operations
The vitality of the Kaspa community has never been in doubt, and their vigilance has brought to light some pivotal issues within the ecosystem of centralized exchanges affecting the Kaspa (KAS) cryptocurrency.
Problems with Exchange Withdrawals
The community has been reporting frequent withdrawal halts by exchanges like MEXC, often under the guise of wallet maintenance. These interruptions are not random; they often coincide with significant price hikes, leading to speculations that exchanges might be manipulating withdrawals to influence market selling. Here is a quote from CaptainAltcoin:
We’re also aware that @MEXC_Official and other exchanges continue to arbitrarily halt Kaspa withdrawals for extended periods of time, citing wallet maintenance. These exchanges fail to meet industry standards for downtime.
— Kaspa Report, March 20, 2025
Transparency and Reserve Verification
Another red flag concerns Bybit, which has omitted Kaspa from its proof of reserve audits. This lack of transparency, especially with the movement of substantial funds in and out of Bybit’s wallet #2, raises questions about the integrity of reserve holdings and potential off-market transactions:
“The community has been unable to reconcile Bybit’s reported Kaspa trading volumes with the large purchases and withdrawals from wallet #2, leading to speculation about possible dark pool transactions.”
Kaspa Report’s Advisory
Given these findings, the Kaspa Report has issued a cautionary advisory:
With that said, we cannot recommend any safe trading platforms because all platforms have risks. Those wanting to accumulate Kaspa should leave their trading to native exchanges and use self-custody wallet options for ease of transactions.
— Kaspa Report, March 20, 2025
The Case for Decentralized Solutions
These setbacks underscore the broader market need for decentralized systems like Kaspa which aim to:
Provide high block creation rates
Implement block parallelism for efficiency
Ensure transparency through zero-knowledge proofs and reverse auctions
Investors are encouraged to embrace native trading platforms and self-custody wallets to protect their KAS holdings. For ongoing updates, you can follow more about crypto on X (Twitter), CoinMarketCap, and Binance Square, or join our FREE Telegram group for real-time alerts.
Why eToro Stands Out for Crypto Investors
Don’t invest unless you’re prepared to lose all the money you invest. This is a high-risk investment and you should not expect to be protected if something goes wrong. Take 2 mins to learn more
Key Features:
Active user community with social features for better engagement
Diverse asset range including stocks, ETFs, and cryptocurrencies
Copy trading to automate investments by mimicking successful traders
User-friendly interface for both web and mobile platforms
A recent Twitter exchange between Shai Deshe, a noted crypto commentator, and an unnamed critic has sparked a significant discussion about the credibility and research surrounding the cryptocurrency $kas. The debate began when Deshe was challenged to “do better research” regarding $kas, leading to a volley of resources provided by Deshe in defense of his knowledge on the subject. However, the critic dismissed these discussions as irrelevant, fueling a broader online conversation.
The Challenge
The discussion ignited when the critic questioned the depth of Deshe’s research into $kas, a lesser-known cryptocurrency. This accusation led Deshe to counter with links and references supporting his position, showcasing a detailed understanding of the topic.
The Response
Despite being presented with sound counter-arguments, the critic’s response was to dismiss the conversation entirely, stating that “discussions are irrelevant.” This dismissal has become a focal point for many observers, who see it as a refusal to engage in constructive dialogue.
Reactions on Social Media
The tweet by Deshe quickly amassed comments, ranging from supportive to critical, illustrating the heated nature of cryptocurrency discussions:
Support for Deshe
@CryptoEnthusiast123: “Shai did his homework! It’s clear this guy just doesn’t want to be proven wrong.”
@DigitalNomad: “The irony of asking for more research and then dismissing presented evidence…”
Critical of the Dismissal
@SkepticalInvestor: “If you can’t accept a reasoned response, why start the argument?”
@TruthSeeker: “This is exactly why public discourse on crypto is often reduced to nothing but noise. No one really wants to learn.”
Neutral Observations
@AnalyticMinds: “Interesting to see how quickly a discussion can deteriorate in the volatile crypto space.”
@Watcher: “Both sides could have learned from this if the conversation had continued.”
Broader Implications
This interaction highlights a common challenge within online financial communities, particularly within the volatile and speculative world of cryptocurrency:
Polarization: There is often a stark divide between believers and skeptics, with little middle ground for nuanced discussion.
Knowledge Sharing: Platforms like Twitter can be excellent for sharing information but can also foster environments where misinformation thrives due to knee-jerk reactions.
Accountability: Engaging in public debates requires participants to stand by their statements, showcasing the importance of accountability in digital dialogues.
Conclusion
The Twitter spat between Shai Deshe and his critic serves as a microcosm of the larger debates within the cryptocurrency community. It underscores the need for deeper engagement, open-mindedness, and the acknowledgment that constructive criticism can lead to better understanding and innovation in the rapidly evolving world of digital currency.
Kaspa (KAS) Price Performance: Market Analysis for March 21
Kaspa (KAS), a notable name in the cryptocurrency market, has witnessed a decline in its price on March 21, dropping by more than 6% to reach [xai model=”grok-beta” prompt=” Take Original
Kaspa holders can’t be really happy with how the KAS price is performing today since it’s down 6.5% now trading at $0.075.
It looks like Kaspa faced strong resistance at $0.080 this week and was briefly trading above this level, but then got rejected and pulled back to the current levels.
We predicted yesterday that StochRSI and CCI indicators were suggesting there’s a possibility Kaspa retraced to $0.075-$0.078 range and this is exactly what happened. So, let’s see what technicals are telling us today and where could Kaspa price be headed next.
Kaspa Chart: Technical Indicators Analysis
RSI(14) is 46.491 – The Relative Strength Index for Kaspa is currently just below the midpoint of 50. This suggests that KAS is not yet in oversold territory but is leaning slightly toward the bearish side. The asset isn’t showing extreme selling pressure but does lack strong upward momentum at the moment.
STOCHRSI(14) is 80.636 – The Stochastic RSI is showing a high reading above 80, indicating that Kaspa might be approaching overbought conditions within its current RSI range. This could signal a potential short-term pullback or consolidation before further moves upward.
MACD(12,26) is -0.003 – The MACD is slightly below the zero line, showing minimal bearish momentum. The very small negative value suggests the short-term and long-term trends are nearly equal, indicating a possible period of consolidation or indecision in the market.
CCI(14) is 58.2927 – The Commodity Channel Index is moderately positive but not in extreme territory. This indicates some buying pressure exists but isn’t overwhelmingly strong. KAS is showing modest positive momentum according to this indicator.
Ultimate Oscillator is 49.418 – The Ultimate Oscillator reading is just below the 50 midpoint, suggesting a nearly neutral market condition with a slight bearish bias. This multi-timeframe indicator shows balanced buying and selling pressure overall.
ROC is 8.865 – The Rate of Change is positive, showing that Kaspa has gained value compared to its price 14 periods ago. This indicates some underlying positive momentum despite the recent daily pullback.
Based on the current technical indicators, the Kaspa price appears to be in a consolidation phase after its recent rejection at the $0.080 level. The slightly bearish RSI and MACD suggest limited downside risk, while the positive CCI and ROC indicate some underlying strength remains.
For today, Kaspa is likely to trade within the $0.072 to $0.078 range. The most probable scenario is continued consolidation near current levels around $0.075 as the market digests recent movements.
In a bullish scenario, if buyers step in and push KAS above the $0.078 resistance, we could see a retest of the $0.080 level. For this to happen though, trading volume would need to increase heavily.
In a bearish scenario, if selling pressure increases, Kaspa might test support at $0.072 or potentially drop toward $0.070. The current technical setup suggests this is less likely unless broader market conditions deteriorate.
Overall, traders should watch for a potential period of stabilization before Kaspa makes its next big move in either direction.
Don’t invest unless you’re prepared to lose all the money you invest. This is a high-risk investment and you should not expect to be protected if something goes wrong. Take 2 mins to learn more
Active user community and social features like news feeds, chats for specific coins available for trading. Wide range of assets: cryptocurrencies alongside other investment products such as stocks and ETFs. Copy trading: allows users to copy the trades of leading traders, for free. User-friendly: eToro’s web-based platform and mobile app are user-friendly and easy to navigate.
and make a new unique news article, [make sure to use headers and sub headers, use html tags as well it is a wordpress post]” max_tokens=”3500″ temperature=”1.0″ top_p=”1.0″ presence_penalty=”0″ frequency_penalty=”0″].075. This price action comes after the coin encountered significant resistance at the [xai model=”grok-beta” prompt=” Take Original
Kaspa holders can’t be really happy with how the KAS price is performing today since it’s down 6.5% now trading at $0.075.
It looks like Kaspa faced strong resistance at $0.080 this week and was briefly trading above this level, but then got rejected and pulled back to the current levels.
We predicted yesterday that StochRSI and CCI indicators were suggesting there’s a possibility Kaspa retraced to $0.075-$0.078 range and this is exactly what happened. So, let’s see what technicals are telling us today and where could Kaspa price be headed next.
Kaspa Chart: Technical Indicators Analysis
RSI(14) is 46.491 – The Relative Strength Index for Kaspa is currently just below the midpoint of 50. This suggests that KAS is not yet in oversold territory but is leaning slightly toward the bearish side. The asset isn’t showing extreme selling pressure but does lack strong upward momentum at the moment.
STOCHRSI(14) is 80.636 – The Stochastic RSI is showing a high reading above 80, indicating that Kaspa might be approaching overbought conditions within its current RSI range. This could signal a potential short-term pullback or consolidation before further moves upward.
MACD(12,26) is -0.003 – The MACD is slightly below the zero line, showing minimal bearish momentum. The very small negative value suggests the short-term and long-term trends are nearly equal, indicating a possible period of consolidation or indecision in the market.
CCI(14) is 58.2927 – The Commodity Channel Index is moderately positive but not in extreme territory. This indicates some buying pressure exists but isn’t overwhelmingly strong. KAS is showing modest positive momentum according to this indicator.
Ultimate Oscillator is 49.418 – The Ultimate Oscillator reading is just below the 50 midpoint, suggesting a nearly neutral market condition with a slight bearish bias. This multi-timeframe indicator shows balanced buying and selling pressure overall.
ROC is 8.865 – The Rate of Change is positive, showing that Kaspa has gained value compared to its price 14 periods ago. This indicates some underlying positive momentum despite the recent daily pullback.
Based on the current technical indicators, the Kaspa price appears to be in a consolidation phase after its recent rejection at the $0.080 level. The slightly bearish RSI and MACD suggest limited downside risk, while the positive CCI and ROC indicate some underlying strength remains.
For today, Kaspa is likely to trade within the $0.072 to $0.078 range. The most probable scenario is continued consolidation near current levels around $0.075 as the market digests recent movements.
In a bullish scenario, if buyers step in and push KAS above the $0.078 resistance, we could see a retest of the $0.080 level. For this to happen though, trading volume would need to increase heavily.
In a bearish scenario, if selling pressure increases, Kaspa might test support at $0.072 or potentially drop toward $0.070. The current technical setup suggests this is less likely unless broader market conditions deteriorate.
Overall, traders should watch for a potential period of stabilization before Kaspa makes its next big move in either direction.
Don’t invest unless you’re prepared to lose all the money you invest. This is a high-risk investment and you should not expect to be protected if something goes wrong. Take 2 mins to learn more
Active user community and social features like news feeds, chats for specific coins available for trading. Wide range of assets: cryptocurrencies alongside other investment products such as stocks and ETFs. Copy trading: allows users to copy the trades of leading traders, for free. User-friendly: eToro’s web-based platform and mobile app are user-friendly and easy to navigate.
and make a new unique news article, [make sure to use headers and sub headers, use html tags as well it is a wordpress post]” max_tokens=”3500″ temperature=”1.0″ top_p=”1.0″ presence_penalty=”0″ frequency_penalty=”0″].080 level earlier in the week.
Market Dynamics: Resistance and Pullback
Kaspa briefly traded above the [xai model=”grok-beta” prompt=” Take Original
Kaspa holders can’t be really happy with how the KAS price is performing today since it’s down 6.5% now trading at $0.075.
It looks like Kaspa faced strong resistance at $0.080 this week and was briefly trading above this level, but then got rejected and pulled back to the current levels.
We predicted yesterday that StochRSI and CCI indicators were suggesting there’s a possibility Kaspa retraced to $0.075-$0.078 range and this is exactly what happened. So, let’s see what technicals are telling us today and where could Kaspa price be headed next.
Kaspa Chart: Technical Indicators Analysis
RSI(14) is 46.491 – The Relative Strength Index for Kaspa is currently just below the midpoint of 50. This suggests that KAS is not yet in oversold territory but is leaning slightly toward the bearish side. The asset isn’t showing extreme selling pressure but does lack strong upward momentum at the moment.
STOCHRSI(14) is 80.636 – The Stochastic RSI is showing a high reading above 80, indicating that Kaspa might be approaching overbought conditions within its current RSI range. This could signal a potential short-term pullback or consolidation before further moves upward.
MACD(12,26) is -0.003 – The MACD is slightly below the zero line, showing minimal bearish momentum. The very small negative value suggests the short-term and long-term trends are nearly equal, indicating a possible period of consolidation or indecision in the market.
CCI(14) is 58.2927 – The Commodity Channel Index is moderately positive but not in extreme territory. This indicates some buying pressure exists but isn’t overwhelmingly strong. KAS is showing modest positive momentum according to this indicator.
Ultimate Oscillator is 49.418 – The Ultimate Oscillator reading is just below the 50 midpoint, suggesting a nearly neutral market condition with a slight bearish bias. This multi-timeframe indicator shows balanced buying and selling pressure overall.
ROC is 8.865 – The Rate of Change is positive, showing that Kaspa has gained value compared to its price 14 periods ago. This indicates some underlying positive momentum despite the recent daily pullback.
Based on the current technical indicators, the Kaspa price appears to be in a consolidation phase after its recent rejection at the $0.080 level. The slightly bearish RSI and MACD suggest limited downside risk, while the positive CCI and ROC indicate some underlying strength remains.
For today, Kaspa is likely to trade within the $0.072 to $0.078 range. The most probable scenario is continued consolidation near current levels around $0.075 as the market digests recent movements.
In a bullish scenario, if buyers step in and push KAS above the $0.078 resistance, we could see a retest of the $0.080 level. For this to happen though, trading volume would need to increase heavily.
In a bearish scenario, if selling pressure increases, Kaspa might test support at $0.072 or potentially drop toward $0.070. The current technical setup suggests this is less likely unless broader market conditions deteriorate.
Overall, traders should watch for a potential period of stabilization before Kaspa makes its next big move in either direction.
Don’t invest unless you’re prepared to lose all the money you invest. This is a high-risk investment and you should not expect to be protected if something goes wrong. Take 2 mins to learn more
Active user community and social features like news feeds, chats for specific coins available for trading. Wide range of assets: cryptocurrencies alongside other investment products such as stocks and ETFs. Copy trading: allows users to copy the trades of leading traders, for free. User-friendly: eToro’s web-based platform and mobile app are user-friendly and easy to navigate.
and make a new unique news article, [make sure to use headers and sub headers, use html tags as well it is a wordpress post]” max_tokens=”3500″ temperature=”1.0″ top_p=”1.0″ presence_penalty=”0″ frequency_penalty=”0″].080 price point, but the anticipation was short-lived. The resistance level proved too strong, resulting in a sharp pullback. This movement was anticipated in our yesterday’s prediction where we highlighted the potential for KAS to revert to the [xai model=”grok-beta” prompt=” Take Original
Kaspa holders can’t be really happy with how the KAS price is performing today since it’s down 6.5% now trading at $0.075.
It looks like Kaspa faced strong resistance at $0.080 this week and was briefly trading above this level, but then got rejected and pulled back to the current levels.
We predicted yesterday that StochRSI and CCI indicators were suggesting there’s a possibility Kaspa retraced to $0.075-$0.078 range and this is exactly what happened. So, let’s see what technicals are telling us today and where could Kaspa price be headed next.
Kaspa Chart: Technical Indicators Analysis
RSI(14) is 46.491 – The Relative Strength Index for Kaspa is currently just below the midpoint of 50. This suggests that KAS is not yet in oversold territory but is leaning slightly toward the bearish side. The asset isn’t showing extreme selling pressure but does lack strong upward momentum at the moment.
STOCHRSI(14) is 80.636 – The Stochastic RSI is showing a high reading above 80, indicating that Kaspa might be approaching overbought conditions within its current RSI range. This could signal a potential short-term pullback or consolidation before further moves upward.
MACD(12,26) is -0.003 – The MACD is slightly below the zero line, showing minimal bearish momentum. The very small negative value suggests the short-term and long-term trends are nearly equal, indicating a possible period of consolidation or indecision in the market.
CCI(14) is 58.2927 – The Commodity Channel Index is moderately positive but not in extreme territory. This indicates some buying pressure exists but isn’t overwhelmingly strong. KAS is showing modest positive momentum according to this indicator.
Ultimate Oscillator is 49.418 – The Ultimate Oscillator reading is just below the 50 midpoint, suggesting a nearly neutral market condition with a slight bearish bias. This multi-timeframe indicator shows balanced buying and selling pressure overall.
ROC is 8.865 – The Rate of Change is positive, showing that Kaspa has gained value compared to its price 14 periods ago. This indicates some underlying positive momentum despite the recent daily pullback.
Based on the current technical indicators, the Kaspa price appears to be in a consolidation phase after its recent rejection at the $0.080 level. The slightly bearish RSI and MACD suggest limited downside risk, while the positive CCI and ROC indicate some underlying strength remains.
For today, Kaspa is likely to trade within the $0.072 to $0.078 range. The most probable scenario is continued consolidation near current levels around $0.075 as the market digests recent movements.
In a bullish scenario, if buyers step in and push KAS above the $0.078 resistance, we could see a retest of the $0.080 level. For this to happen though, trading volume would need to increase heavily.
In a bearish scenario, if selling pressure increases, Kaspa might test support at $0.072 or potentially drop toward $0.070. The current technical setup suggests this is less likely unless broader market conditions deteriorate.
Overall, traders should watch for a potential period of stabilization before Kaspa makes its next big move in either direction.
Don’t invest unless you’re prepared to lose all the money you invest. This is a high-risk investment and you should not expect to be protected if something goes wrong. Take 2 mins to learn more
Active user community and social features like news feeds, chats for specific coins available for trading. Wide range of assets: cryptocurrencies alongside other investment products such as stocks and ETFs. Copy trading: allows users to copy the trades of leading traders, for free. User-friendly: eToro’s web-based platform and mobile app are user-friendly and easy to navigate.
and make a new unique news article, [make sure to use headers and sub headers, use html tags as well it is a wordpress post]” max_tokens=”3500″ temperature=”1.0″ top_p=”1.0″ presence_penalty=”0″ frequency_penalty=”0″].075 to [xai model=”grok-beta” prompt=” Take Original
Kaspa holders can’t be really happy with how the KAS price is performing today since it’s down 6.5% now trading at $0.075.
It looks like Kaspa faced strong resistance at $0.080 this week and was briefly trading above this level, but then got rejected and pulled back to the current levels.
We predicted yesterday that StochRSI and CCI indicators were suggesting there’s a possibility Kaspa retraced to $0.075-$0.078 range and this is exactly what happened. So, let’s see what technicals are telling us today and where could Kaspa price be headed next.
Kaspa Chart: Technical Indicators Analysis
RSI(14) is 46.491 – The Relative Strength Index for Kaspa is currently just below the midpoint of 50. This suggests that KAS is not yet in oversold territory but is leaning slightly toward the bearish side. The asset isn’t showing extreme selling pressure but does lack strong upward momentum at the moment.
STOCHRSI(14) is 80.636 – The Stochastic RSI is showing a high reading above 80, indicating that Kaspa might be approaching overbought conditions within its current RSI range. This could signal a potential short-term pullback or consolidation before further moves upward.
MACD(12,26) is -0.003 – The MACD is slightly below the zero line, showing minimal bearish momentum. The very small negative value suggests the short-term and long-term trends are nearly equal, indicating a possible period of consolidation or indecision in the market.
CCI(14) is 58.2927 – The Commodity Channel Index is moderately positive but not in extreme territory. This indicates some buying pressure exists but isn’t overwhelmingly strong. KAS is showing modest positive momentum according to this indicator.
Ultimate Oscillator is 49.418 – The Ultimate Oscillator reading is just below the 50 midpoint, suggesting a nearly neutral market condition with a slight bearish bias. This multi-timeframe indicator shows balanced buying and selling pressure overall.
ROC is 8.865 – The Rate of Change is positive, showing that Kaspa has gained value compared to its price 14 periods ago. This indicates some underlying positive momentum despite the recent daily pullback.
Based on the current technical indicators, the Kaspa price appears to be in a consolidation phase after its recent rejection at the $0.080 level. The slightly bearish RSI and MACD suggest limited downside risk, while the positive CCI and ROC indicate some underlying strength remains.
For today, Kaspa is likely to trade within the $0.072 to $0.078 range. The most probable scenario is continued consolidation near current levels around $0.075 as the market digests recent movements.
In a bullish scenario, if buyers step in and push KAS above the $0.078 resistance, we could see a retest of the $0.080 level. For this to happen though, trading volume would need to increase heavily.
In a bearish scenario, if selling pressure increases, Kaspa might test support at $0.072 or potentially drop toward $0.070. The current technical setup suggests this is less likely unless broader market conditions deteriorate.
Overall, traders should watch for a potential period of stabilization before Kaspa makes its next big move in either direction.
Don’t invest unless you’re prepared to lose all the money you invest. This is a high-risk investment and you should not expect to be protected if something goes wrong. Take 2 mins to learn more
Active user community and social features like news feeds, chats for specific coins available for trading. Wide range of assets: cryptocurrencies alongside other investment products such as stocks and ETFs. Copy trading: allows users to copy the trades of leading traders, for free. User-friendly: eToro’s web-based platform and mobile app are user-friendly and easy to navigate.
and make a new unique news article, [make sure to use headers and sub headers, use html tags as well it is a wordpress post]” max_tokens=”3500″ temperature=”1.0″ top_p=”1.0″ presence_penalty=”0″ frequency_penalty=”0″].078 range, which is precisely what occurred.
Technical Indicators Overview
Let’s delve into what the technical indicators are currently suggesting for Kaspa:
RSI(14): 46.491
The RSI for Kaspa remains just under the midpoint, indicating that while the coin isn’t in an oversold state, it leans slightly towards bearish conditions without significant selling pressure or strong upward momentum.
STOCHRSI(14): 80.636
With a high Stochastic RSI reading, Kaspa appears to be nearing overbought conditions within its current RSI range. This might foreshadow a potential short-term retreat or a period of consolidation.
The MACD reflects a market with minimal bearish momentum, suggesting a near parity between short-term and long-term trends, which typically signals market indecision.
CCI(14): 58.2927
The Commodity Channel Index indicates some buying interest but not at an overwhelming level, showing modest positive momentum.
Ultimate Oscillator: 49.418
Currently, this indicates a near-neutral market condition with a slight bearish inclination, pointing towards balanced buying and selling pressures.
ROC: 8.865
A positive ROC demonstrates that despite today’s pullback, there’s still underlying positive momentum from 14 periods back.
Today, Kaspa seems poised for a period of stabilization. Here’s how the price might move:
Bullish Scenario: If buying pressure increases, pushing Kaspa past the [xai model=”grok-beta” prompt=” Take Original
Kaspa holders can’t be really happy with how the KAS price is performing today since it’s down 6.5% now trading at $0.075.
It looks like Kaspa faced strong resistance at $0.080 this week and was briefly trading above this level, but then got rejected and pulled back to the current levels.
We predicted yesterday that StochRSI and CCI indicators were suggesting there’s a possibility Kaspa retraced to $0.075-$0.078 range and this is exactly what happened. So, let’s see what technicals are telling us today and where could Kaspa price be headed next.
Kaspa Chart: Technical Indicators Analysis
RSI(14) is 46.491 – The Relative Strength Index for Kaspa is currently just below the midpoint of 50. This suggests that KAS is not yet in oversold territory but is leaning slightly toward the bearish side. The asset isn’t showing extreme selling pressure but does lack strong upward momentum at the moment.
STOCHRSI(14) is 80.636 – The Stochastic RSI is showing a high reading above 80, indicating that Kaspa might be approaching overbought conditions within its current RSI range. This could signal a potential short-term pullback or consolidation before further moves upward.
MACD(12,26) is -0.003 – The MACD is slightly below the zero line, showing minimal bearish momentum. The very small negative value suggests the short-term and long-term trends are nearly equal, indicating a possible period of consolidation or indecision in the market.
CCI(14) is 58.2927 – The Commodity Channel Index is moderately positive but not in extreme territory. This indicates some buying pressure exists but isn’t overwhelmingly strong. KAS is showing modest positive momentum according to this indicator.
Ultimate Oscillator is 49.418 – The Ultimate Oscillator reading is just below the 50 midpoint, suggesting a nearly neutral market condition with a slight bearish bias. This multi-timeframe indicator shows balanced buying and selling pressure overall.
ROC is 8.865 – The Rate of Change is positive, showing that Kaspa has gained value compared to its price 14 periods ago. This indicates some underlying positive momentum despite the recent daily pullback.
Based on the current technical indicators, the Kaspa price appears to be in a consolidation phase after its recent rejection at the $0.080 level. The slightly bearish RSI and MACD suggest limited downside risk, while the positive CCI and ROC indicate some underlying strength remains.
For today, Kaspa is likely to trade within the $0.072 to $0.078 range. The most probable scenario is continued consolidation near current levels around $0.075 as the market digests recent movements.
In a bullish scenario, if buyers step in and push KAS above the $0.078 resistance, we could see a retest of the $0.080 level. For this to happen though, trading volume would need to increase heavily.
In a bearish scenario, if selling pressure increases, Kaspa might test support at $0.072 or potentially drop toward $0.070. The current technical setup suggests this is less likely unless broader market conditions deteriorate.
Overall, traders should watch for a potential period of stabilization before Kaspa makes its next big move in either direction.
Don’t invest unless you’re prepared to lose all the money you invest. This is a high-risk investment and you should not expect to be protected if something goes wrong. Take 2 mins to learn more
Active user community and social features like news feeds, chats for specific coins available for trading. Wide range of assets: cryptocurrencies alongside other investment products such as stocks and ETFs. Copy trading: allows users to copy the trades of leading traders, for free. User-friendly: eToro’s web-based platform and mobile app are user-friendly and easy to navigate.
and make a new unique news article, [make sure to use headers and sub headers, use html tags as well it is a wordpress post]” max_tokens=”3500″ temperature=”1.0″ top_p=”1.0″ presence_penalty=”0″ frequency_penalty=”0″].078 resistance, we might see it retest the [xai model=”grok-beta” prompt=” Take Original
Kaspa holders can’t be really happy with how the KAS price is performing today since it’s down 6.5% now trading at $0.075.
It looks like Kaspa faced strong resistance at $0.080 this week and was briefly trading above this level, but then got rejected and pulled back to the current levels.
We predicted yesterday that StochRSI and CCI indicators were suggesting there’s a possibility Kaspa retraced to $0.075-$0.078 range and this is exactly what happened. So, let’s see what technicals are telling us today and where could Kaspa price be headed next.
Kaspa Chart: Technical Indicators Analysis
RSI(14) is 46.491 – The Relative Strength Index for Kaspa is currently just below the midpoint of 50. This suggests that KAS is not yet in oversold territory but is leaning slightly toward the bearish side. The asset isn’t showing extreme selling pressure but does lack strong upward momentum at the moment.
STOCHRSI(14) is 80.636 – The Stochastic RSI is showing a high reading above 80, indicating that Kaspa might be approaching overbought conditions within its current RSI range. This could signal a potential short-term pullback or consolidation before further moves upward.
MACD(12,26) is -0.003 – The MACD is slightly below the zero line, showing minimal bearish momentum. The very small negative value suggests the short-term and long-term trends are nearly equal, indicating a possible period of consolidation or indecision in the market.
CCI(14) is 58.2927 – The Commodity Channel Index is moderately positive but not in extreme territory. This indicates some buying pressure exists but isn’t overwhelmingly strong. KAS is showing modest positive momentum according to this indicator.
Ultimate Oscillator is 49.418 – The Ultimate Oscillator reading is just below the 50 midpoint, suggesting a nearly neutral market condition with a slight bearish bias. This multi-timeframe indicator shows balanced buying and selling pressure overall.
ROC is 8.865 – The Rate of Change is positive, showing that Kaspa has gained value compared to its price 14 periods ago. This indicates some underlying positive momentum despite the recent daily pullback.
Based on the current technical indicators, the Kaspa price appears to be in a consolidation phase after its recent rejection at the $0.080 level. The slightly bearish RSI and MACD suggest limited downside risk, while the positive CCI and ROC indicate some underlying strength remains.
For today, Kaspa is likely to trade within the $0.072 to $0.078 range. The most probable scenario is continued consolidation near current levels around $0.075 as the market digests recent movements.
In a bullish scenario, if buyers step in and push KAS above the $0.078 resistance, we could see a retest of the $0.080 level. For this to happen though, trading volume would need to increase heavily.
In a bearish scenario, if selling pressure increases, Kaspa might test support at $0.072 or potentially drop toward $0.070. The current technical setup suggests this is less likely unless broader market conditions deteriorate.
Overall, traders should watch for a potential period of stabilization before Kaspa makes its next big move in either direction.
Don’t invest unless you’re prepared to lose all the money you invest. This is a high-risk investment and you should not expect to be protected if something goes wrong. Take 2 mins to learn more
Active user community and social features like news feeds, chats for specific coins available for trading. Wide range of assets: cryptocurrencies alongside other investment products such as stocks and ETFs. Copy trading: allows users to copy the trades of leading traders, for free. User-friendly: eToro’s web-based platform and mobile app are user-friendly and easy to navigate.
and make a new unique news article, [make sure to use headers and sub headers, use html tags as well it is a wordpress post]” max_tokens=”3500″ temperature=”1.0″ top_p=”1.0″ presence_penalty=”0″ frequency_penalty=”0″].080 level. However, this requires a substantial increase in trading volume.
Bearish Scenario: Should selling pressure intensify, a further drop towards testing the support at [xai model=”grok-beta” prompt=” Take Original
Kaspa holders can’t be really happy with how the KAS price is performing today since it’s down 6.5% now trading at $0.075.
It looks like Kaspa faced strong resistance at $0.080 this week and was briefly trading above this level, but then got rejected and pulled back to the current levels.
We predicted yesterday that StochRSI and CCI indicators were suggesting there’s a possibility Kaspa retraced to $0.075-$0.078 range and this is exactly what happened. So, let’s see what technicals are telling us today and where could Kaspa price be headed next.
Kaspa Chart: Technical Indicators Analysis
RSI(14) is 46.491 – The Relative Strength Index for Kaspa is currently just below the midpoint of 50. This suggests that KAS is not yet in oversold territory but is leaning slightly toward the bearish side. The asset isn’t showing extreme selling pressure but does lack strong upward momentum at the moment.
STOCHRSI(14) is 80.636 – The Stochastic RSI is showing a high reading above 80, indicating that Kaspa might be approaching overbought conditions within its current RSI range. This could signal a potential short-term pullback or consolidation before further moves upward.
MACD(12,26) is -0.003 – The MACD is slightly below the zero line, showing minimal bearish momentum. The very small negative value suggests the short-term and long-term trends are nearly equal, indicating a possible period of consolidation or indecision in the market.
CCI(14) is 58.2927 – The Commodity Channel Index is moderately positive but not in extreme territory. This indicates some buying pressure exists but isn’t overwhelmingly strong. KAS is showing modest positive momentum according to this indicator.
Ultimate Oscillator is 49.418 – The Ultimate Oscillator reading is just below the 50 midpoint, suggesting a nearly neutral market condition with a slight bearish bias. This multi-timeframe indicator shows balanced buying and selling pressure overall.
ROC is 8.865 – The Rate of Change is positive, showing that Kaspa has gained value compared to its price 14 periods ago. This indicates some underlying positive momentum despite the recent daily pullback.
Based on the current technical indicators, the Kaspa price appears to be in a consolidation phase after its recent rejection at the $0.080 level. The slightly bearish RSI and MACD suggest limited downside risk, while the positive CCI and ROC indicate some underlying strength remains.
For today, Kaspa is likely to trade within the $0.072 to $0.078 range. The most probable scenario is continued consolidation near current levels around $0.075 as the market digests recent movements.
In a bullish scenario, if buyers step in and push KAS above the $0.078 resistance, we could see a retest of the $0.080 level. For this to happen though, trading volume would need to increase heavily.
In a bearish scenario, if selling pressure increases, Kaspa might test support at $0.072 or potentially drop toward $0.070. The current technical setup suggests this is less likely unless broader market conditions deteriorate.
Overall, traders should watch for a potential period of stabilization before Kaspa makes its next big move in either direction.
Don’t invest unless you’re prepared to lose all the money you invest. This is a high-risk investment and you should not expect to be protected if something goes wrong. Take 2 mins to learn more
Active user community and social features like news feeds, chats for specific coins available for trading. Wide range of assets: cryptocurrencies alongside other investment products such as stocks and ETFs. Copy trading: allows users to copy the trades of leading traders, for free. User-friendly: eToro’s web-based platform and mobile app are user-friendly and easy to navigate.
and make a new unique news article, [make sure to use headers and sub headers, use html tags as well it is a wordpress post]” max_tokens=”3500″ temperature=”1.0″ top_p=”1.0″ presence_penalty=”0″ frequency_penalty=”0″].072 or lower could be on the cards. This is less likely unless broader market sentiments shift negatively.
The most probable path today is for Kaspa to remain within the [xai model=”grok-beta” prompt=” Take Original
Kaspa holders can’t be really happy with how the KAS price is performing today since it’s down 6.5% now trading at $0.075.
It looks like Kaspa faced strong resistance at $0.080 this week and was briefly trading above this level, but then got rejected and pulled back to the current levels.
We predicted yesterday that StochRSI and CCI indicators were suggesting there’s a possibility Kaspa retraced to $0.075-$0.078 range and this is exactly what happened. So, let’s see what technicals are telling us today and where could Kaspa price be headed next.
Kaspa Chart: Technical Indicators Analysis
RSI(14) is 46.491 – The Relative Strength Index for Kaspa is currently just below the midpoint of 50. This suggests that KAS is not yet in oversold territory but is leaning slightly toward the bearish side. The asset isn’t showing extreme selling pressure but does lack strong upward momentum at the moment.
STOCHRSI(14) is 80.636 – The Stochastic RSI is showing a high reading above 80, indicating that Kaspa might be approaching overbought conditions within its current RSI range. This could signal a potential short-term pullback or consolidation before further moves upward.
MACD(12,26) is -0.003 – The MACD is slightly below the zero line, showing minimal bearish momentum. The very small negative value suggests the short-term and long-term trends are nearly equal, indicating a possible period of consolidation or indecision in the market.
CCI(14) is 58.2927 – The Commodity Channel Index is moderately positive but not in extreme territory. This indicates some buying pressure exists but isn’t overwhelmingly strong. KAS is showing modest positive momentum according to this indicator.
Ultimate Oscillator is 49.418 – The Ultimate Oscillator reading is just below the 50 midpoint, suggesting a nearly neutral market condition with a slight bearish bias. This multi-timeframe indicator shows balanced buying and selling pressure overall.
ROC is 8.865 – The Rate of Change is positive, showing that Kaspa has gained value compared to its price 14 periods ago. This indicates some underlying positive momentum despite the recent daily pullback.
Based on the current technical indicators, the Kaspa price appears to be in a consolidation phase after its recent rejection at the $0.080 level. The slightly bearish RSI and MACD suggest limited downside risk, while the positive CCI and ROC indicate some underlying strength remains.
For today, Kaspa is likely to trade within the $0.072 to $0.078 range. The most probable scenario is continued consolidation near current levels around $0.075 as the market digests recent movements.
In a bullish scenario, if buyers step in and push KAS above the $0.078 resistance, we could see a retest of the $0.080 level. For this to happen though, trading volume would need to increase heavily.
In a bearish scenario, if selling pressure increases, Kaspa might test support at $0.072 or potentially drop toward $0.070. The current technical setup suggests this is less likely unless broader market conditions deteriorate.
Overall, traders should watch for a potential period of stabilization before Kaspa makes its next big move in either direction.
Don’t invest unless you’re prepared to lose all the money you invest. This is a high-risk investment and you should not expect to be protected if something goes wrong. Take 2 mins to learn more
Active user community and social features like news feeds, chats for specific coins available for trading. Wide range of assets: cryptocurrencies alongside other investment products such as stocks and ETFs. Copy trading: allows users to copy the trades of leading traders, for free. User-friendly: eToro’s web-based platform and mobile app are user-friendly and easy to navigate.
and make a new unique news article, [make sure to use headers and sub headers, use html tags as well it is a wordpress post]” max_tokens=”3500″ temperature=”1.0″ top_p=”1.0″ presence_penalty=”0″ frequency_penalty=”0″].072 to [xai model=”grok-beta” prompt=” Take Original
Kaspa holders can’t be really happy with how the KAS price is performing today since it’s down 6.5% now trading at $0.075.
It looks like Kaspa faced strong resistance at $0.080 this week and was briefly trading above this level, but then got rejected and pulled back to the current levels.
We predicted yesterday that StochRSI and CCI indicators were suggesting there’s a possibility Kaspa retraced to $0.075-$0.078 range and this is exactly what happened. So, let’s see what technicals are telling us today and where could Kaspa price be headed next.
Kaspa Chart: Technical Indicators Analysis
RSI(14) is 46.491 – The Relative Strength Index for Kaspa is currently just below the midpoint of 50. This suggests that KAS is not yet in oversold territory but is leaning slightly toward the bearish side. The asset isn’t showing extreme selling pressure but does lack strong upward momentum at the moment.
STOCHRSI(14) is 80.636 – The Stochastic RSI is showing a high reading above 80, indicating that Kaspa might be approaching overbought conditions within its current RSI range. This could signal a potential short-term pullback or consolidation before further moves upward.
MACD(12,26) is -0.003 – The MACD is slightly below the zero line, showing minimal bearish momentum. The very small negative value suggests the short-term and long-term trends are nearly equal, indicating a possible period of consolidation or indecision in the market.
CCI(14) is 58.2927 – The Commodity Channel Index is moderately positive but not in extreme territory. This indicates some buying pressure exists but isn’t overwhelmingly strong. KAS is showing modest positive momentum according to this indicator.
Ultimate Oscillator is 49.418 – The Ultimate Oscillator reading is just below the 50 midpoint, suggesting a nearly neutral market condition with a slight bearish bias. This multi-timeframe indicator shows balanced buying and selling pressure overall.
ROC is 8.865 – The Rate of Change is positive, showing that Kaspa has gained value compared to its price 14 periods ago. This indicates some underlying positive momentum despite the recent daily pullback.
Based on the current technical indicators, the Kaspa price appears to be in a consolidation phase after its recent rejection at the $0.080 level. The slightly bearish RSI and MACD suggest limited downside risk, while the positive CCI and ROC indicate some underlying strength remains.
For today, Kaspa is likely to trade within the $0.072 to $0.078 range. The most probable scenario is continued consolidation near current levels around $0.075 as the market digests recent movements.
In a bullish scenario, if buyers step in and push KAS above the $0.078 resistance, we could see a retest of the $0.080 level. For this to happen though, trading volume would need to increase heavily.
In a bearish scenario, if selling pressure increases, Kaspa might test support at $0.072 or potentially drop toward $0.070. The current technical setup suggests this is less likely unless broader market conditions deteriorate.
Overall, traders should watch for a potential period of stabilization before Kaspa makes its next big move in either direction.
Don’t invest unless you’re prepared to lose all the money you invest. This is a high-risk investment and you should not expect to be protected if something goes wrong. Take 2 mins to learn more
Active user community and social features like news feeds, chats for specific coins available for trading. Wide range of assets: cryptocurrencies alongside other investment products such as stocks and ETFs. Copy trading: allows users to copy the trades of leading traders, for free. User-friendly: eToro’s web-based platform and mobile app are user-friendly and easy to navigate.
and make a new unique news article, [make sure to use headers and sub headers, use html tags as well it is a wordpress post]” max_tokens=”3500″ temperature=”1.0″ top_p=”1.0″ presence_penalty=”0″ frequency_penalty=”0″].078 range, digesting recent market movements.
Why eToro Could Be Your Platform for Kaspa Trading
Kaspa ($KAS), a relatively new player in the world of cryptocurrencies, has been making waves with its unique approach to blockchain security and efficiency. According to a recent tweet by KASPAdamus, Kaspa claims to be the “most MEV resistant network to ever exist,” a bold statement that’s stirred significant interest among blockchain enthusiasts and investors alike.
What is MEV Resistance?
MEV, or Miner Extractable Value, refers to the profit miners can make by including, excluding, or reordering transactions within blocks. This has often been associated with vulnerabilities exploited by miners to gain additional revenue, leading to potential centralization and fairness issues in blockchains.
The True Motivation Behind Kaspa’s 1-10-100bps Design: The unique block-reward system in Kaspa, which scales as the block size increases, is intended to make MEV-based strategies less profitable, thereby enhancing network security and decentralization.
Breaking Down the MEV Resistance
The discussion between @DesheShai and @xximpod in the linked video provides insights into how Kaspa’s design inherently combats the effects of MEV:
Block Reward Adjustments: Kaspa employs a dynamic block reward system that adjusts based on the block’s timestamp, making the strategy of MEV less lucrative.
Scalability: By ensuring that the block reward scales in a way that discourages manipulation, Kaspa maintains a high level of security alongside scalability.
Miner Incentives: Miners are incentivized to behave honestly due to the diminishing returns on manipulating transaction order or content.
Community Reactions
Following the announcement and the subsequent discussions, the crypto community’s reactions have been mixed:
Positive Feedback: Many applauded Kaspa for its innovative approach to mining rewards and its commitment to decentralization. Comments like “Great innovation from Kaspa. This could really set a new standard for mining incentives” highlight the community’s approval.
Skepticism: Some remain skeptical about the practical implications and longevity of Kaspa’s MEV resistance, with questions regarding “proof-of-concept in real-world scenarios” being common.
Curiosity and Inquiry: Several users expressed interest in further details on the mechanics of Kaspa’s MEV resistance, indicating a healthy curiosity and desire to understand more deeply.
In summary, Kaspa’s bold claim of being the most MEV resistant network has not only sparked interest but also a broad spectrum of reactions from the crypto community. While its long-term success remains to be seen, its approach offers a fresh perspective on addressing one of blockchain’s significant challenges. Whether Kaspa can maintain its promise and commitment to a truly decentralized and secure PoW network will be closely watched by industry observers.
Kaspa’s Potential Listing on Binance: Will It Climb to ?
The crypto community is buzzing with anticipation as Coinvo, a well-regarded X page with a robust following of over 320,000, recently posted a poll questioning the potential impact of Kaspa (KAS) listing on Binance. Could this listing catapult Kaspa’s price to the coveted mark?
The Community Weighs In
Engagement with the post was significant, amassing over 55,000 views. The sentiment was largely optimistic, with many in the Kaspa community voicing their belief that a listing on Binance could indeed see the cryptocurrency reach or even exceed . Here’s a summary of the feedback:
The general consensus among X users was affirmative, expecting a price spike post-listing.
Several users, including “@EatMyPi92”, suggested that the price might not jump immediately to but would eventually surpass this milestone due to market dynamics and Binance’s influence.
Do you think $KAS will reach if it’s listed on Binance? 👇
While optimism was high, skepticism persisted. User “@NextinLine” highlighted the potential for a price dump following a Binance listing, referencing similar trends with other tokens. However, they also acknowledged the possibility of being wrong:
Analysts’ Perspectives
An analyst from the YouTube channel s c a p e provided an in-depth analysis regarding Kaspa’s potential to hit :
BTC Comparisons
Historical data was used to draw comparisons with Bitcoin’s growth trajectory when it was at a similar market cap stage. The analyst noted:
Kaspa’s current market cap approximates Bitcoin’s when it was trading at around [xai model=”grok-beta” prompt=” Take Original
Coinvo, a popular crypto page on X with more than 320 thousand followers, made a post to gauge what the Kaspa community thinks about KAS price potentially listing on Binance and whether the price could spike to $1 if this happens.
The tweet garnered massive engagement with more than 55,000 views. Many users expressed their views about this possibility, with most comments agreeing that Kaspa could reach $1 if such a listing occurs. Many users even believe that regardless of a Binance listing, Kaspa’s price can reach $1 during this market cycle.
Do you think $KAS will reach $1 if it's listed on Binance?
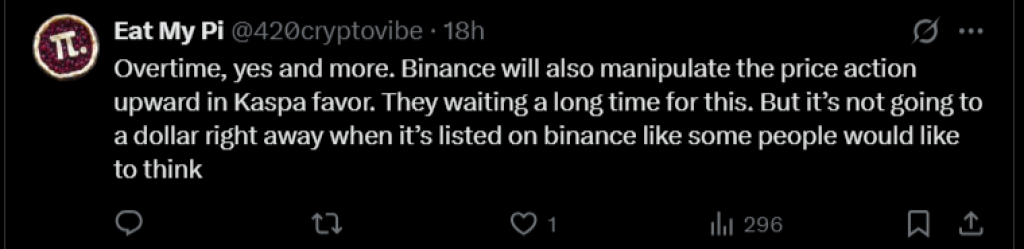
Some community members are even more optimistic, suggesting the price could go far beyond $1. User “Eat My Pi” expressed that over time, Kaspa would reach $1 and beyond, adding that Binance might even manipulate the price action upward in Kaspa’s favor since they’ve been waiting for this listing for a long time. However, the user cautioned that it wouldn’t reach a dollar immediately upon being listed on Binance, contrary to what some might expect.
However, not all users share this optimism. Some think that a Binance listing won’t make any significant change for the token. A user named “I’m next on the line” expects a potential dump similar to other tokens recently listed on the exchange, though they acknowledged they could be wrong.
Another user, 𝑯𝒂𝒏 𝑶𝒎𝒆𝒊𝒄𝒉, emphasized that market conditions would play a crucial role. According to this user, if the market maintains a bullish sentiment, Kaspa could easily reach the $1 mark.
Analyst Analysis: Is $1 Coming in 2025?
An analyst from the YouTube channel s c a p e shared comprehensive insights about Kaspa potentially reaching $1 in 2025. The analyst began by highlighting the positive price action for Kaspa, noting that Bitcoin continues its macro uptrend in the current bull cycle.
According to the analyst, Kaspa’s performance relative to Bitcoin looks primed for an explosion, potentially doubling in price in the coming weeks.
New Buy Button on CoinMarketCap & Binance Speculation
The analyst pointed out an interesting development on CoinMarketCap, where a buy button has appeared on Kaspa’s page that wasn’t previously there. While some users suggested this button is standard for tokens with spot and futures listings on Binance, the analyst noted that Kaspa has been listed on Binance futures for over a year, yet the buy button was only recently added, hinting at possible developments.
According to the analyst, Coinbase has been consistently teasing a Kaspa listing week after week. The analyst also mentioned large channels with around 1 million followers that are associated with Binance. While not directly affiliated with the exchange, the analyst theorized that Binance might be paying these substantial channels to promote Kaspa, potentially building hype before an official exchange listing.
The analyst described the current market situation as “absolute capitulation,” dismissing the possibility of Kaspa dropping to the $0.05 range. From multiple perspectives, the analyst noted that Kaspa is extremely oversold, a condition not seen since its earliest days.
The analyst elaborated that Kaspa’s current value relative to Bitcoin is equivalent to when it was worth just $0.02, emphasizing that Kaspa hasn’t been this undervalued compared to Bitcoin since that price point. The analyst presented this as evidence of how significantly undervalued Kaspa currently is.
With significant price potential for the upcoming altseason, particularly for Kaspa, the analyst suggested that taking short positions represents unnecessary risk. Instead, the analyst advocated for buying and holding as the preferable strategy.
The analyst further explained that even for cryptocurrencies like XRP that have already experienced substantial runs, their performance relative to Bitcoin indicates significant room for further growth.
The analyst believes the timing of major listings will be crucial for Kaspa, Nacho, and Kango. With Wintermute serving as a market maker, these projects are awaiting favorable Kaspa price action to establish their treasuries at fairer values before entering significant listing contracts. Combined with upcoming smart contract functionality for Kaspa, the analyst suggested these factors are positioning Kaspa for explosive price action.
Drawing parallels to Bitcoin’s early days, the analyst noted that Kaspa currently has a market cap of approximately 1.8 to 1.9 billion dollars. When Bitcoin had a similar market cap about 12 years ago, it was trading at around $0.76-$0.80.
The analyst recalled Bitcoin’s subsequent trajectory, where after reaching that market cap and experiencing a temporary decline, Bitcoin saw explosive growth that took it from $0.76 all the way to $1,242. This comparison was used to provide perspective on where Kaspa might go in its next bullish cycle.
The analyst calculated that Bitcoin experienced a 20x increase from that price point. Applying the same multiplier to Kaspa at $0.05 would yield a price of $1 to $1.20. Based on this comparison to Bitcoin, the analyst suggested that Kaspa’s next peak is likely to be around the one-dollar mark.
However, the analyst considers the $1 prediction to be conservative, personally projecting that Kaspa could reach between $3 to $5, potentially up to $10, particularly during the next bull market pump.
Don’t invest unless you’re prepared to lose all the money you invest. This is a high-risk investment and you should not expect to be protected if something goes wrong. Take 2 mins to learn more
Active user community and social features like news feeds, chats for specific coins available for trading. Wide range of assets: cryptocurrencies alongside other investment products such as stocks and ETFs. Copy trading: allows users to copy the trades of leading traders, for free. User-friendly: eToro’s web-based platform and mobile app are user-friendly and easy to navigate.
and make a new unique news article, [make sure to use headers and sub headers, use html tags as well it is a wordpress post]” max_tokens=”3500″ temperature=”1.0″ top_p=”1.0″ presence_penalty=”0″ frequency_penalty=”0″].80, suggesting room for significant growth.
If Kaspa mimics Bitcoin’s past bull runs, it could see its price multiply several times over.
Market and Event Watch
Additionally, developments like the mysterious addition of a “buy” button on Kaspa’s CoinMarketCap page, alongside rumors of a potential Coinbase listing:
These events are closely watched by investors for signs of an impending surge in price.
Coinbase continuously teasing the listing adds to the speculation.
Looking Ahead
The possibility of Kaspa reaching during this market cycle seems plausible based on community sentiment, market conditions, and speculative analysis. Here are key takeaways:
A Binance listing could significantly influence Kaspa’s market performance.
The community and analysts alike see considerable growth potential in Kaspa, especially if market conditions remain favorable.
However, caution prevails with some, highlighting the unpredictability of crypto market trends.
For those with an eye on Kaspa’s future prospects, the upcoming periods could prove to be pivotal, with market-wide sentiment and listing news potentially setting the stage for a significant price movement.
Active user community and social features like news feeds, chats for specific coins available for trading.
Wide range of assets: cryptocurrencies alongside other investment products such as stocks and ETFs.
Copy trading: copy the trades of leading traders, for free.
User-friendly platform and mobile app.

 Surges: Bullish Breakthrough Today, March 21!”")


 Yes
Yes No
No