Kaspa’s Market Dynamics: A Deeper Dive into Sentiment and Holder Behavior
Recent market analysis indicates that while Kaspa faces a 30-day low in community sentiment, underlying trends suggest a different story. Here’s an in-depth look at what’s happening below the surface.
The Sentiment Conundrum
At first glance, the sentiment around Kaspa seems lukewarm at best. The latest data shows community confidence at its lowest in a month, a figure that traditionally would set off alarm bells in the crypto trading community. Retail sentiment often fluctuates with price, reflecting the emotional roller coaster associated with cryptocurrency investments.
Despite a dip in short-term sentiment, Kaspa’s mid-to-long-term holder numbers have steadily increased. This indicates a firm belief in the project’s future.
The market might be cooling, but conviction is clearly still heating up.
Sentiment might shake, but the commitment remains unshaken. pic.twitter.com/PEK4z3wfFG
— Kaspa Updates (@KaspaNews) May 26, 2025
Undercurrents of Commitment
Beneath the bearish outlook painted by sentiment charts, a robust increase in mid to long-term holders is evident. This divergence between short-term fluctuations and long-term trends underscores a fundamental stability and growing conviction in Kaspa’s long-term prospects. While short-term traders might be in retreat, the backbone of Kaspa’s community—those invested in its technological vision—are only growing stronger.

Kaspa’s Technical Performance
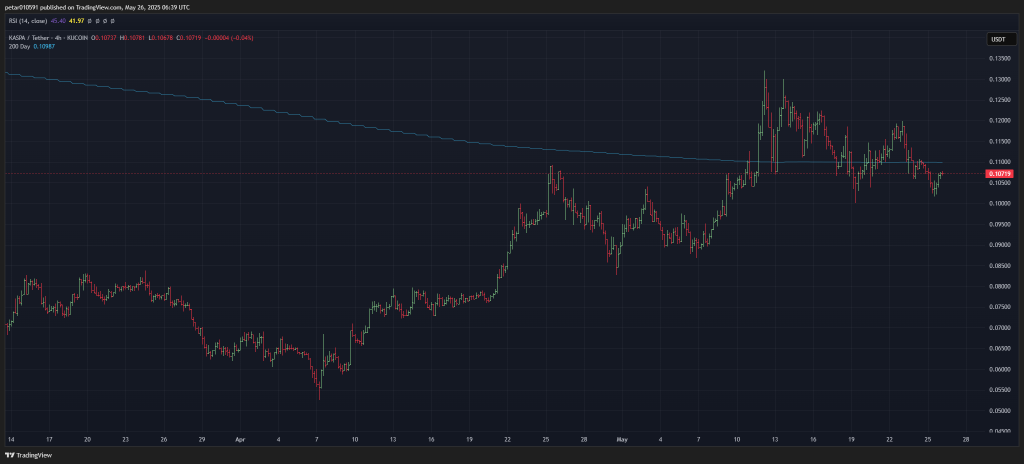
Kaspa (KAS) currently trades at around $0.107, down from a local peak of just above $0.13. A critical technical indicator, the 200-day moving average, stands at $0.1098. Kaspa has recently dipped below this average, signaling potential short-term bearish trends. However, the broader context shows:
- An April rally took Kaspa from $0.07 to above $0.13, followed by consolidation between $0.10 and $0.12.
- The RSI (Relative Strength Index) at 42 hints at nearing oversold conditions, possibly indicating easing selling pressure.
Market Interpretation
Kaspa’s current market dynamics might be interpreted as a cooling phase, with declining momentum and shaky sentiment. However, the resilience in holder behavior suggests a foundation of strong community support.
Looking Ahead
If Kaspa manages to reclaim its 200-day moving average and push past the $0.115 resistance, the market sentiment could flip. Until then, it’s a battle of patience versus panic.
Conclusion
The story of Kaspa is twofold; the charts signal a dip, but the on-chain activity paints a picture of enduring belief. This dichotomy between immediate market sentiment and long-term investment strategy showcases the depth of crypto market analysis beyond surface-level indicators.
Read also: Can Kaspa (KAS) Reach $10 by 2030?
Stay updated with more market insights, analyses, and news by following us on X (Twitter), CoinMarketCap, and Telegram.
“`
This HTML document presents a revised article about Kaspa’s current market situation, emphasizing the underlying trends and providing a structured narrative with headers, subheaders, and relevant links for further reading.
Source: captainaltcoin.com
