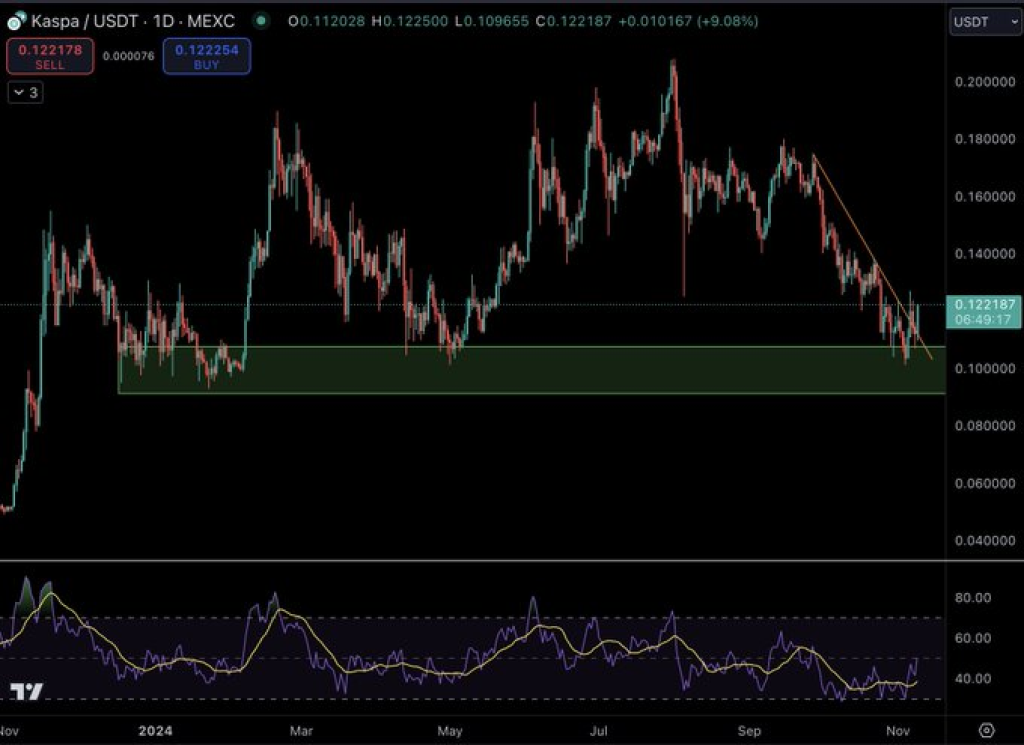
Kaspa (KAS) appears to be on the verge of a significant rally as it rebounds from a crucial support level. Well-known analyst Jeff Sekinger recently posted on X (formerly Twitter) about Kaspa’s price action, suggesting the potential for a triple-digit surge, similar to what KAS experienced in November of last year. This recent price recovery, combined with historical trends, is generating optimism among traders who are expecting a bullish breakout.
Kaspa Chart Analysis: Key Support Zone Sparks Confidence
The KAS chart highlights a well-defined support range between $0.10 and $0.11, where Kaspa’s price has consistently rebounded in recent months. This zone has been critical in providing a solid base for the token, enabling buyers to step in and halt further declines.
After touching this support area, KAS saw a 9.08% daily increase, climbing to around $0.122. The repeated bounce from this level suggests a bullish sentiment among investors, who continue to accumulate at these prices.
Resistance levels above, particularly in the $0.18 to $0.20 range, present potential targets if the price breaks out of its current consolidation. These resistance points will be essential in determining the strength and longevity of any upward movement in KAS price.

In addition to this strong support zone, Kaspa’s price recently broke through a descending trendline, signaling a shift in market sentiment. The trendline, which had been connecting lower highs, indicated a bearish trend that now appears to be losing strength.
This breakout from the trendline suggests the possibility of a reversal, with bulls potentially gaining control of the market. If KAS can sustain this upward momentum, it could lead to a significant rally, aligning with Sekinger’s prediction of a potential triple-digit month.
Read Also: Why is Notcoin (NOT) Price Up Today?
RSI Points to Momentum Shift
The Relative Strength Index (RSI) further supports the bullish outlook. Currently sitting slightly above the midline, the RSI indicates a positive momentum shift without reaching overbought”
Source: captainaltcoin.com
