“`html
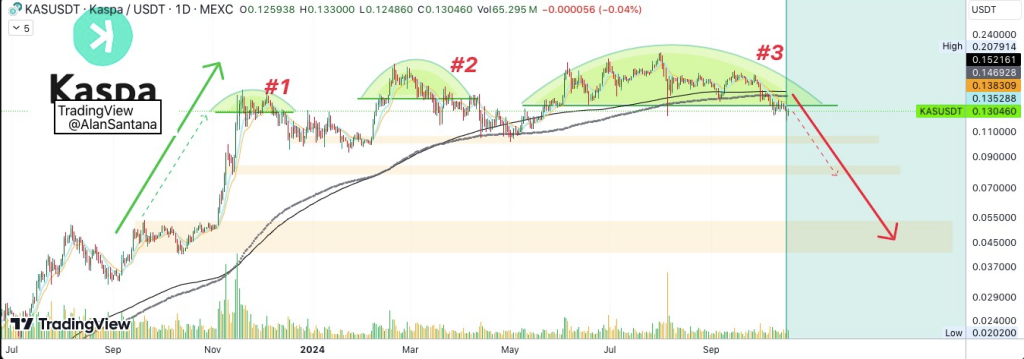
Kaspa (KAS) is currently under significant bearish pressure, according to a recent analysis by Trader Santana on TradingView. Santana’s insights reveal that KAS may be on the verge of a major decline, with several bearish patterns emerging on the daily chart.
The trader’s analysis suggests that a price crash could be imminent, advising investors to brace for a potential downturn in either Kaspa or the broader cryptocurrency market.
The analysis begins by identifying the formation of three rounded tops, a well-known bearish reversal pattern. These patterns, which have developed over recent months, indicate that KAS has been transitioning from a bullish to a bearish trend. Rounded tops typically signal weakening buying momentum, leading to lower highs and eventually a downward movement.

Additionally, the chart reveals a “mirror image” pattern, where a previous bullish spike has been mirrored by a recent bearish downturn. This pattern is characterized by a green upward arrow on the left, mirrored by a red downward arrow on the right, suggesting that the previous upward trend may reverse. According to Santana, this reflection is a strong signal of a possible downturn for Kaspa.
Trading Below Key Moving Averages Adds to Bearish Outlook
Another critical point in Santana’s analysis is Kaspa’s position relative to key moving averages. KAS is currently trading below several important levels, including the EMA233, MA200, EMA144, and EMA89. Falling below these moving averages is often a sign of sustained bearish sentiment, as these lines generally act as dynamic resistance.
Santana’s report stresses that the inability to reclaim these moving averages indicates continued downward pressure. He advises traders to monitor any attempts to break above these levels, as failure to do so could confirm the ongoing bearish trend.
