Over the past year, we’ve become quite familiar with Kaspa’s bullish momentum, so it’s understandable that traders feel uneasy when the price isn’t climbing.
In the last 30 days, the KAS price has seen a modest increase of 4%, now hovering just below $0.17. However, this slight uptick doesn’t capture the full picture.
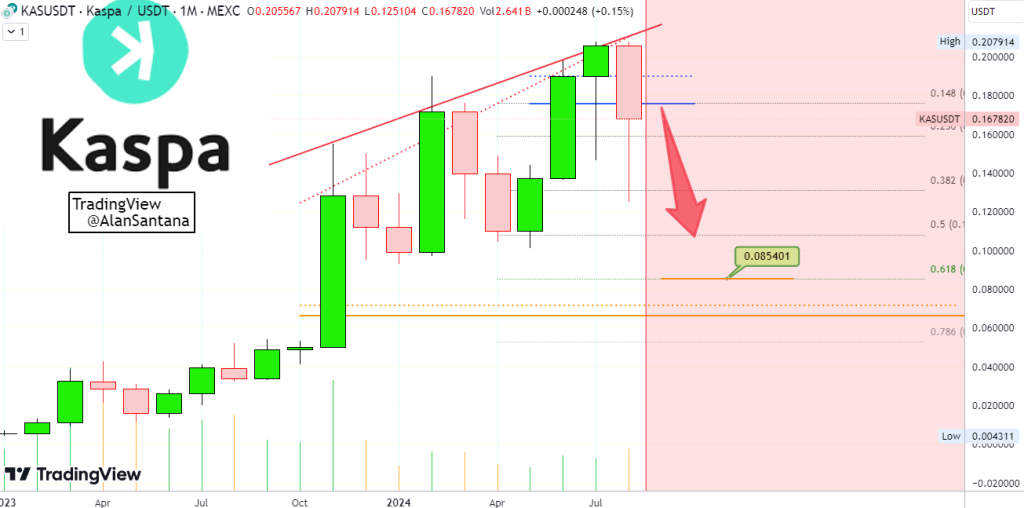
Elite crypto trader Alan Santana recently shared a Kaspa price analysis, cautioning about a potential 49% price drop.
Kaspa Chart Breakdown
Santana’s analysis suggests a challenging short-term outlook for Kaspa. He remarked, “Here we have the long-term chart for Kaspa. This is the worst month so far.”
At the top of the chart, there’s a red line that has been a significant resistance level for KAS. It acts like a ceiling, preventing the price from breaking through. Each time KAS attempts to surpass this level, it gets pushed back down.
But that’s not the only concern. The blue lines on the chart, which were expected to act as support levels where buyers typically intervene, have been breached. It’s akin to watching a high-wire act where the safety net has been removed.

Now, let’s discuss those candles. July’s candle closed as what traders refer to as a “hammer.” While that might sound positive, like it’s “hammer time” for the bulls, it’s actually a warning sign when it appears after a prolonged uptrend. It often indicates that the uptrend might be nearing its end. August isn’t looking any better, with the red candle signaling a potential exit from the bull market.
The trading volume in August has surged, reaching levels not seen since last December. High volume on a bearish candle is like hearing thunder after seeing lightning—it’s a sign that a storm, possibly a wave of selling, is on the horizon.
Read also: This Kaspa Rival Is a $Billion Crypto In the Making – Here’s Why
Fibonacci Retracement and Price Targets
Santana didn’t stop there. He utilized Fibonacci retracement levels, a tool traders use to”
Source: captainaltcoin.com
